Rationalising or downsizing your network
In an ever-changing marketplace, a business needs to evolve to stay competitive. With costs spiralling, this is more important than ever, and every store in your network needs to be optimally sited, appropriately staffed and scaled to service the customers in its catchment.
It can be difficult to approach such an exercise objectively; after all you may have to make hard decisions about which stores need to change or even close. Change will affect people’s lives as well as your bottom line, so you need to consider every possible factor in a network review before you begin to rationalise or downsize.
Location data provides a vital tool in assessing your store locations and the potential audience around them. A small investment here can save money, jobs, and even your whole business, as it enables you to move forward with a more sustainable network based in the most profitable locations.
How wide is each store’s catchment?
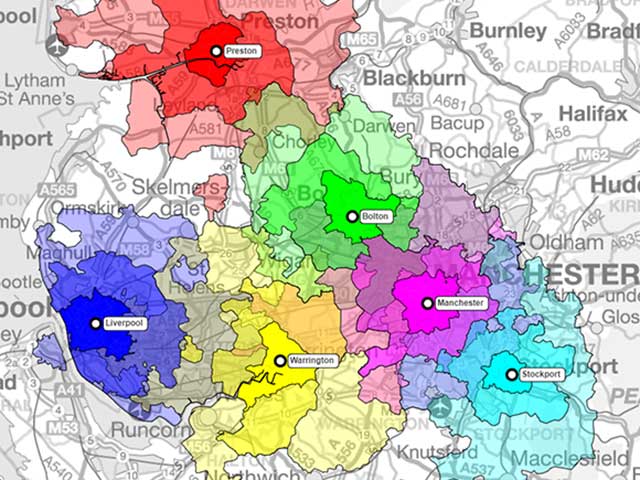
The first step is to work out each store’s effective catchment area in order to estimate potential profitability of the store. There are two approaches to this:
- Customer / database led: If you are fortunate enough to have a customer database you can use your existing customers to work out how far people are willing to travel to visit your store. From just postcode data you can plot your existing customers on a map and work out longest and average distance that people are willing to travel to shop at that store. It is a valuable exercise to calculate both distance travelled and time of journey, as journey time is often a more meaningful measure in consumer decision making.
- Journey time led: For those without existing customer data, plotting travel time or distance radii around each store can help you to work out a meaningful catchment. The journey time you use will vary on the product type you sell: shorter for fast moving consumer goods (FMCG), longer for aspirational or specialist products.
For journey distance and time calculations we use our own drivetime data. This is a matrix of journey times and distances based on average travel times, vehicle class, road type and number of junctions between each postcode sector. Regularly reviewed, this pre-calculated data allows for incredibly quick and accurate journey time and distance plotting on large quantities of data. It makes plotting travel radii around a network of stores incredibly quick and convenient. Variables such as vehicle type and travel time also allow you to calculate the efficiency of your delivery fleet as well as consumer journeys.
Quantify actual and potential customers in your store catchment
Once you have a store catchment calculated, you need to analyse the people within it. Again, there are two approaches depending on whether you have existing customer data or not.
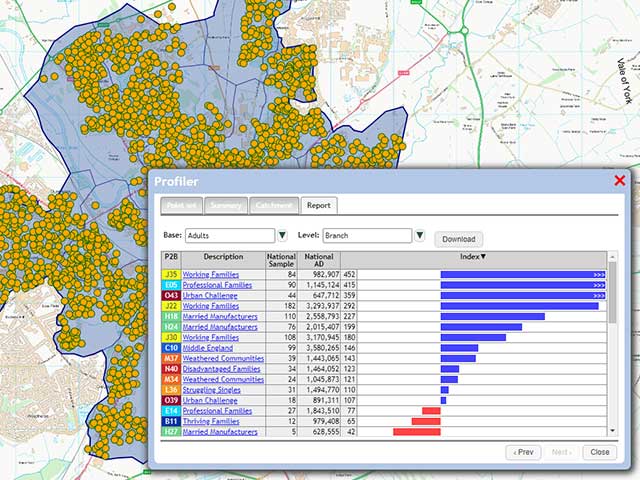
- Profile your customer database using customer postcodes you can append a geodemographic grouping to them. Looking at the percentage of customers from each group within your total database to find out which are most likely to buy from you. If you also have customer spend data, you can also calculate which demographic group is likely to spend more in your stores.
- Create a pen portrait of your ideal customer and find the geodemographic profiles that most closely match this.
Once you know your ideal customer groups, you can index the amount of that profile within each store’s catchment. This will tell you how fertile that territory is likely to be and provide a snapshot of each store’s performance against its counterparts in other locations. This information will help you to shortlist those stores that need more scrutiny.
For geodemographic profiling we use P² People & Places (P²), our own classification tool built from census and lifestyle data. It uses 16 major groups, which we call “trees”, and 44 sub-groups, known as ""branches", to provide a great degree of granularity in consumer analysis.
Calculate local competition for the customer base
You can use a similar approach on your competitors’ stores - all you need is a postcode and an idea of the type of customers that shop with them. In fact, we recommend you do this for two important reasons:
- A full picture of penetration in an area and how much competition for these ideal customer groups there is.
- Insight into competitors’ key target audience by applying geodemographic indexing to the area around their stores. You can then infer if you are competing for the same people as well as the same area.
Once you have catchments and customer groupings mapped for competitor and your own stores you can look to see which stores share a customer base. With multiple stores feeding off the same area they risk cannibalising each other’s customers. This can provide you with another shortlisting criteria for outlets that are in need of closer scrutiny.
Targeted marketing before targeted store closures
Each store represents a major investment in infrastructure and the impact of redundancies on people’s lives should not be under-played. The profiling work you have undertaken up to this point will highlight any potential new audiences close to each store. This creates opportunities for targeted promotions or campaigns to generate new footfall for your store before you revert to closures and network consolidation.
For example, now that you have an ideal customer profile, you could use geodemographic mapping to create a target list of postcodes for door drop activity, or use Postcode Address File (PAF) to generate mailing lists, to promote the most relevant product set from your store. You also have the option of trying to widen your store catchment, by targeting your highest propensity customer profile further afield.
Time well spent
Given the long-term commitment and expense that a fixed location brings to your organisation, investing the time and resource to ensure that your network is as robust as possible is absolutely justified. A well-planned and efficient sales network will allow your business to thrive, even in an uncertain economy. For just a few hundred pounds for a single store or a few thousand for a large store network, you can ensure that your company is as resilient, efficient, and profitable as it can possibly be. Given the overheads of a fixed store or distribution location, it would be money well spent.
We are always happy to talk through these projects and share our experience and will always provide a formal quote before you incur any cost, so why not email info@beacon-dodsworth.co.uk and see how we can help your business to thrive.