Using GIS technologies to visualise wildlife population changes
The middle of November sees a day to celebrate the use and implementation of GIS and similar technologies. Instead of our usual content of business efficiency and analysis we thought we could illustrate the use of GIS for ecological and wildlife studies.
Mapping otter sightings
A search online produced data looking at otter sightings in England from the late 1970’s to the early 2000’s. The data meant we could draw some illustrative maps for otter sightings across the country. The dataset had a record of the date of sighting and location in latitude and longitude. To keep sighting locations secure the coordinates are rounded somewhat.
The point of the exercise was to illustrate the changes in otter distributions over a longer period. It shows that our mapping system can import, analyse and display data with postcode, british national grid and latitude longitude location data.
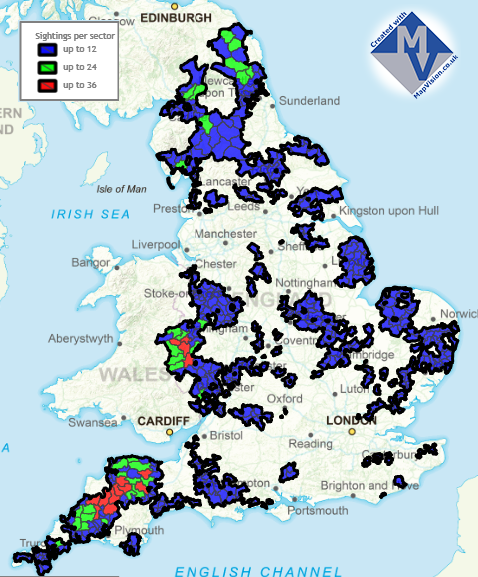
The summary of the sightings is not too helpful, otters are spread across much of England and there are more of them in the wilder more remote areas.
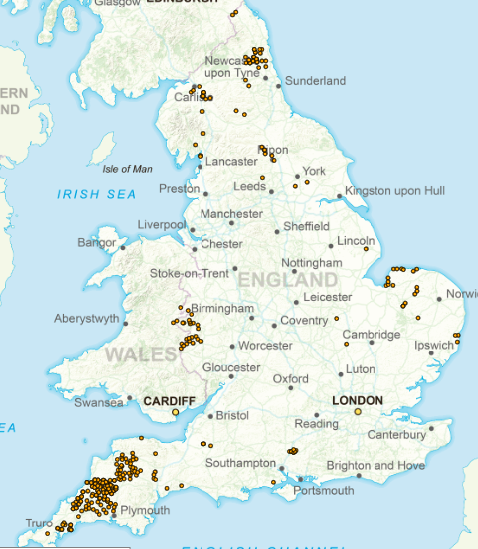
Splitting the data out into time bands meant we could produce some longitudinal maps that showed how the otter ranges expanded over the last years of the 20th century. The data has not been evenly spread across the whole survey period from 1977 to 2001. The ranges work out as 1977 to 1985, 1986 to 1995, and after 1996. The record counts are interesting: 1977 to 1985 has 288 records, 1986 to 1995 has 872 records, and after 1996 has 1137.
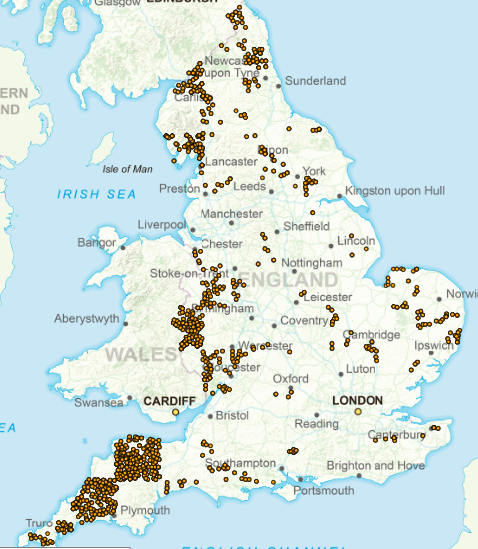
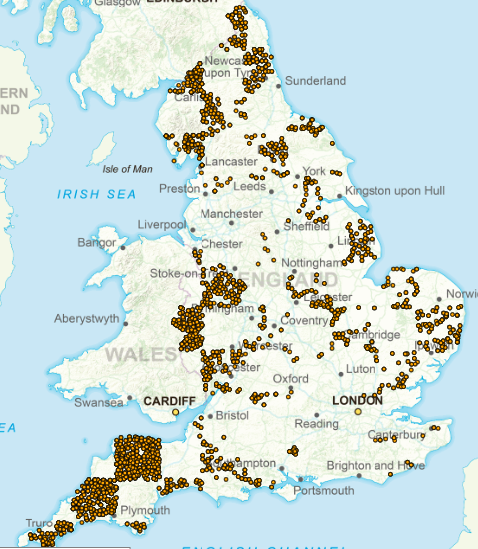
Without the spatial analysis the picture would be much harder to recognise.