From spreadsheet to map: how to create your first postcode point map
So you have a spreadsheet full of postcodes that you’d like to turn into a visual data map. We’ve spent 30 years mapping data and creating mapping tools, so we like to think we know a little about postcode maps.
The challenge of “simply” plotting postcodes on a map
Using postcodes as a geographical key provides its own challenges. The UK postcode system is completely unique, its alphanumeric format has developed organically over more than 100 years. It is specifically developed around our town and county system and is also constantly changing. Some nations use a fully numeric system, others have no nationwide postcode system at all.
This means that postcode mapping requires highly specialist tools and accurate local data, making it unattractive to global, mass-market software providers. For example, neither Microsoft Excel nor Google Sheets will convert a postcode list into a map for you with some kind of nifty inclusive wizard. In fact, both companies have discontinued their dedicated low cost or free mapping tools (MapPoint and Fusion Tables).
The good news is that any programme that can export data into common spreadsheet (such as .xls) or text format (for example .csv) files allows you to go on and map that data. Even better, with the latest low-cost web-based mapping tools you no longer need a powerful, complex or expensive GIS (geographic information system).

Avoiding the pitfalls of postcode mapping
Scaling your data and choosing your map type
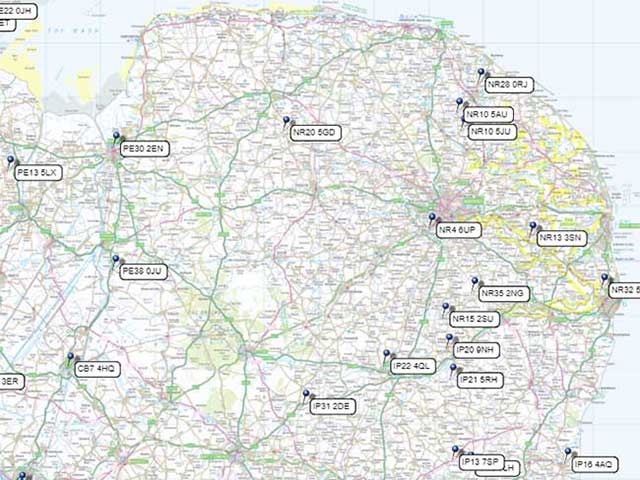
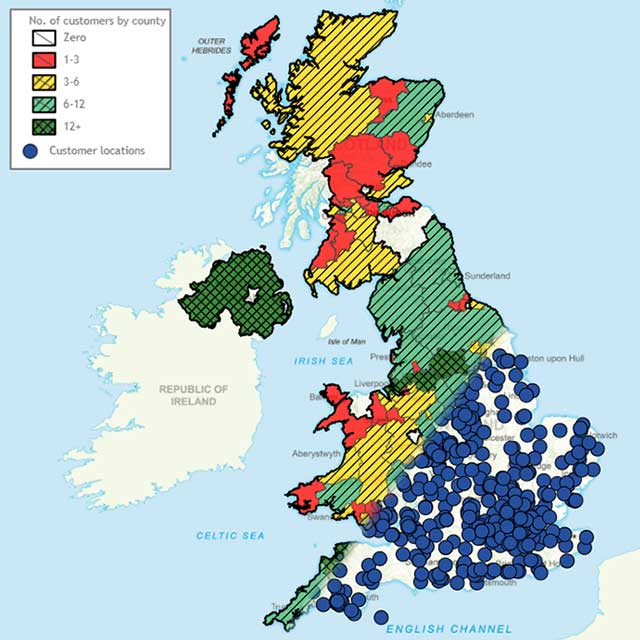
Just changing list data into a visual map helps to make it more understandable at-a-glance. However, think of the questions you want to answer before you import your data. A handful of postcodes plotted on a map can be informative and help you to analyse your data and make business decisions effectively. But, if you intend to try and plot any more than a few hundred postcodes you might want to consider breaking the project down or using less granular detail - even a point map will be overwhelmed by this level of data and cease to be an effective visual aid!
For larger datasets:
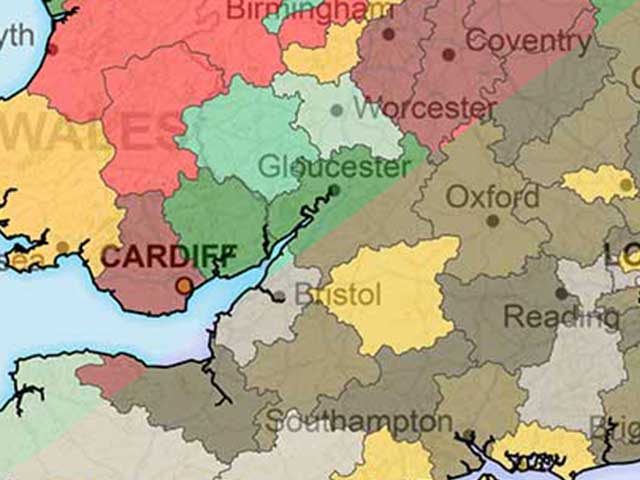
- Create a heat map rather than a postcode point map: Heat maps - also known as hot/cold, catchment, territory, or choropleth maps - aggregate individual points of data into a localised trend. They use a colour code to show comparative values and are a great way to make really dense datasets understandable at-a-glance.
- Break your mapping project down into regional sub-projects: a UK-wide pin map of thousands of customers will overwhelm a viewer, but a “postcode area” map of a couple of hundred will be easier to comprehend.
- Use a less granular level of detail on your map: On a point map, you could move up the postcode hierarchy to map the “centroid" of the postcode sector, rather than whole postcodes – something commonly done in geographic data analysis to avoid long processing times and difficulties in comprehension of data.

Data quality for better maps
Whatever level of detail you aim for, make sure that your data is consistent and well formatted. The UK postcode system is structured and makes sense but it is not logical as a computer sees it. Computers struggle with something as esoteric as the alphanumeric postcode system, so won’t correct you if you have a zero instead of the letter “o” for example.
If you find that your data is missing postcodes or you have suspect postcodes that you’d like to check are correct, there are data providers out there who provide the latest postcode lists. The two we work with are Royal Mail with their PAF product, and the Office for National Statistics (ONS) with their Office for National Statistics Postcode Directory (ONSPD) dataset.
Geocoding postcodes for a basic map
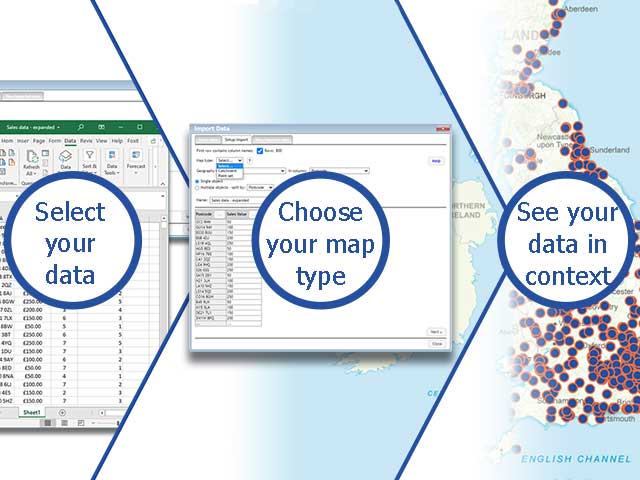
A good postcode mapping tool will have a simple import function. MapVision for example is a 3-step import.
- Select your data: Simply point the programme to the spreadsheet and data column you want to map or “geocode”.
- Choose your map type: Select either a point map or a catchment/territory map and off you go.
- Review the process: The third step is a report of any import failures, such as incorrect postcodes. If you’ve prepared your data carefully, you can ignore this step.
Refining your map to get the data you want
Hooray, you have successfully geocoded your data! This means you now have some dots or coloured areas on a map. This first pass often raises more questions than it answers and the move from spreadsheet to visual data map is a difficult one to predict. It could instantly answer the question you originally asked, but seeing your data in a geographical context will trigger other questions. On the other hand, you may look at the data and see that your map is overwhelmed, or notice sparse areas or data you failed to include. Few people create a single data map and stop there. Geographic analysis is normally an iterative process and there is a very good reason we make it so easy to import and geocode data into a map.

Make your postcode map easy for others to understand
Once all of the data you want is included you will need to think about formatting. Odds are, you won’t be the only person who needs convincing of your decision. The default format of any mapping programme is designed to be neutral and inoffensive. Any mapping programme worth its salt will allow you to theme your maps however you wish:
- Theme the map's colours on the data subject itself.
- Match your organisation’s brand colours to present it to the board.
- Use your own favourite colour scheme.
- Choose colours for deliberate contrast.
Be aware though, if you are working on a web programme like MapVision, you’ll need to save these themes if you want to quickly and easily apply them to future maps – and we’d recommend consistency between maps once you decide on a scheme.
Visual data analysis needs to be clear and accessible
The whole purpose of visual data analysis is to make the data clear to a viewer. So make sure that any map that will be viewed by others is accessible and easy to comprehend. Mapping comes with a lot of preconceptions that are terrible for those with even minor visual handicaps. For example, the red-amber-green (RAG) scheme so common in heat maps, is awful for a colour-blind person to try and comprehend. In fact, the bold colour themes that worked so well in your spreadsheet to differentiate data are unlikely to work so well on a map. Move away from bold colour blocks and towards softer – but distinct – shades. Using patterns to supplement your colour scheme will help less visually-able viewers comprehend the data and a large key is a must!

From postcode map to full geographical analysis
So now you have your beautiful, clear postcode map, what next? Geographic and visual data analysis is incredibly open ended. There is always something you can add in. An effective mapping system lets you overlay multiple data layers onto your map, so that you can change the map to analyse the most relevant topic at any time. Once you have plotted some data on a map, you will think of a lot of other data that you would like to include in your visual analysis. For example, the locations of customers, sales reps, stores, competitors, distributors, wholesalers, retailers, transport hubs, similar businesses, local facilities, population centres, traffic black spots, demographic trends. The real challenge in data mapping is knowing when to stop and actually make those hard decisions that triggered the process in the first place.