What is GIS mapping?
GIS stands for Geographic Information System, a software tool for presenting data visually in a geographical context - i.e. on a map - and offering a range of tools to analyse this data further. Presenting data in this way is often called GIS mapping, data mapping or location intelligence.
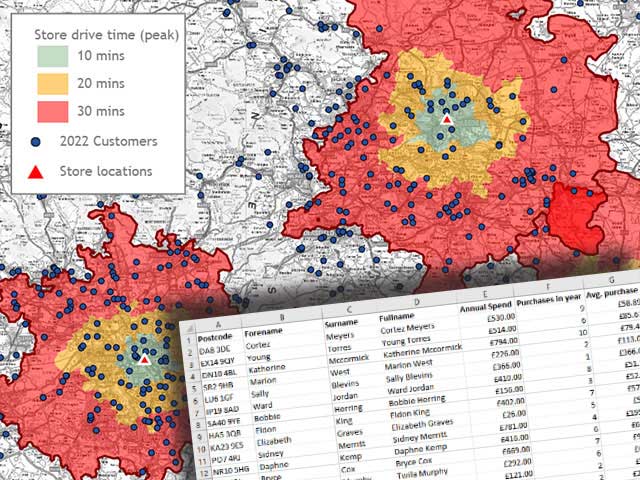
A basic example might be mapping locations of a store network alongside nearby influencing features such as roads, transport hubs or competitors. At a more advanced level, a GIS could display multi-layer data including geographic features with colour and overlays showing sales territories, customer densities, demographic groups, or market penetration in an area.
Visualising complex data makes it easier to understand at a glance. Seeing these factors in a geographical context also gives a depth of understanding to allow informed decisions. These decisions can also be easily demonstrated to others using the same intuitive data maps.
The types of data used in a GIS
You will always find two types of data in GIS software: raster data and vector data.
Raster data is the background map images themselves, on which other data is displayed. Because we specialise in UK business data, our raster data comes from Ordnance Survey (OS) or Collins Bartholomew, as their road network and infrastructure maps give the perfect amount of data for business, network, or customer analysis. Another GIS, focussed on geology for example, might use topographical maps, aerial photographs, three dimensional imagery, or even Lidar images as its rasters.
Vector data plots locations in a geometric way that means they can be processed accurately by computer. This information is then displayed visually as points, lines or areas in the correct location on top of the raster image. Vectors can be used to enhance the raster data - for example accurately showing road or rail networks or topographical data - or plot any data with a geographical key accurately onto a data layer over the raster.
The data to be displayed is usually held in a table of some kind whether that is CSV, spreadsheet, or a database file, and is called “attribute data” by GIS consultants. This could be site locations, sales territories, competitor, customer, or resident data. Once this data has been plotted as vector data it can be exported and read by another GIS in file formats such as Shapefile, KML or POD; most GIS providers have their own proprietary file names, but a good GIS can open all major GIS files.
Case study: network management and gap analysis
Vibrant Energy Matters Limited is the UK’s largest property services company. They use a GIS to allocate the closest, suitably skilled consultant to clients on a daily basis. They also conduct regular territory gap analysis to identify recruitment needs and ensure that they are operating at optimum efficiency.
The applications of GIS mapping
Bringing attribute and location data together and displaying it visually lends itself to analysis of almost anything. Globally, people use GIS mapping to look at climate, migration, and economic trends. Nationally people look at population changes, social trends, and crime patterns, whilst locally the scope for detailed analysis of any feature is possible.
Here are a few examples of the uses you could put a GIS to, taken from our own experience:
- Location mapping: The most basic application of a GIS, but no single map contains all of the location data that you might need. For example, a road map won’t tell you anything about the buildings near a road, whilst a residential map won’t give you any insight into local facilities, services and points of interest. A GIS can bring all of the information you need into one place and display it.
- Map the characteristics of a region: Organisations often need to investigate demographic groups, network data (such as road, rail, and utilities), or socio-economic data within their current or potential future operating area.
- Analyse distance or travel time: How easy is it for customers to reach your location? Equally, how easy is it for your sales team or delivery fleet to service customers? This can be very useful for defining sales, delivery or franchise territories.
- Monitor trends and change in a geographic region: How has an area developed or the population changed? Local authorities use GIS analysis to identify vulnerable groups and the effectiveness of local services.
- Visualise quantity, density, and value of an audience: How many people of a certain type live within an area, what proportion of these are current customers, do the remainder match the profile of potential good customers.
What are the benefits of GIS mapping?
GIS mapping turns complex table data into easily-understood visual data. It also puts data into the context of the world around it. As such it helps people to make well-informed decisions or identify areas to explore in more depth.
It can help organisations to understand their operations in the context of the customers around them and the transport and delivery networks on which they rely. Just look at some of our case studies to see how it has helped numerous businesses in different sectors.
Case study: Bringing audience data together to identify new markets

RSAcademics is an educational consultancy offering strategic marketing and research to schools. GIS mapping is an important part of the value they provide. They bring together affluence, demography and population growth data and factor in drive-times to identify potential audiences for their client schools.
How to choose a GIS
So, you’ve seen the benefits of GIS mapping, but how you choose to obtain your location analysis also needs some thought. Your final solution will be driven by a number of factors:
- Geography: Are you looking for global or continental analysis or focussed on the UK? Are you looking to analyse topographical or GPS data, or are you working around existing UK postcode and administrative boundaries - our specialty.
- Size of business: Do you have an in-house data expert who has the time and knowledge to get the most out of a full-feature desktop GIS or do you need something a bit more intuitive?
- Frequency of use: Is this a one-off analysis or the first of many? For those infrequent jobs you might be better-served by asking a GIS consultant to do it on your behalf.
- Depth of analysis: Do you need advanced scheduling or analysis tools, or are your location intelligence needs more modest? Would an online data mapping system be sufficient or do you need to invest in a powerful, desktop GIS?
- Your budget: For one-off jobs, consultancy tends to be the cheapest option, whilst the need for trained staff and dedicated software makes desktop GIS the most expensive option. Online mapping tools fall in between with low subscription costs and easy-to-use interface making training unnecessary.
Let us help you
We’ve been working with GIS mapping for more than 25 years. Our specialty is UK postcode and administrative geography. Our GIS mapping solutions range from our online data mapping tool: MapVision, a powerful desktop GIS: Prospex GIS, through to bespoke consultancy where we do the work for you. Get in touch and we can talk you through the options suitable for your organisation to get the geographic analysis you need.