Postcode mapping and data visualisation
Putting your data into a geographical context is a great way to get to grips with large amounts of information and add an extra dimension to your understanding. Here are just a few ways you can harness your postcode data:
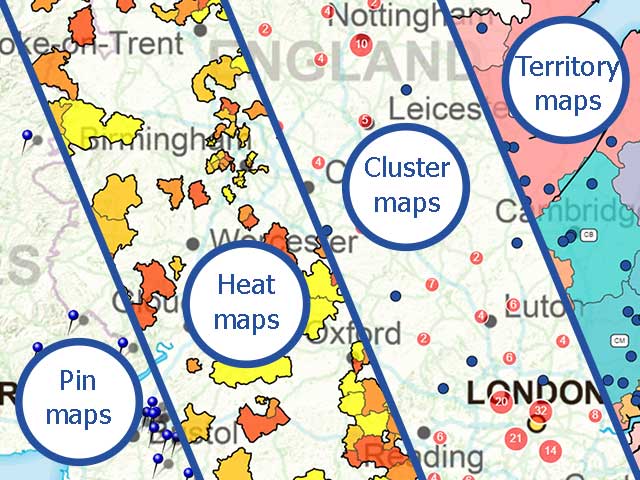
Postcode point mapping
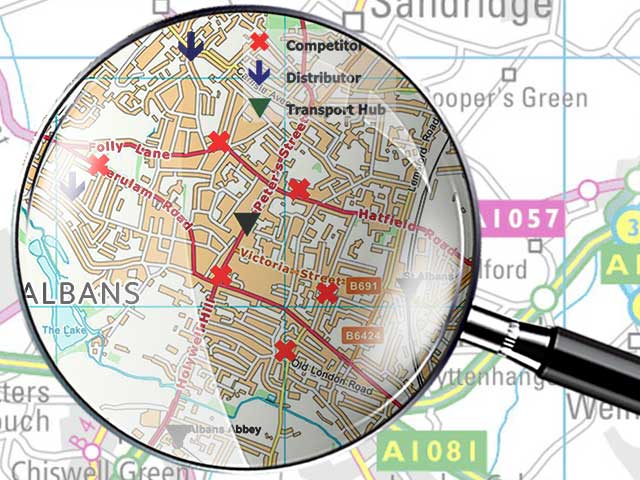
A point set map provides an easy way to understand your table data in a visual format. These points could be anything you’d like mapped: your best customers, your store or sales network, even competitors and distributors. Map points can be based on:
- Full UK postcodes
- A central point calculated from incomplete postcodes, postcode sectors or postcode areas
- Ordnance Survey National Grid reference or coordinates
- Latitude and longitude data
- Centralised points calculated from administrative geography
Point sets can be colour coded and use custom icons, so multiple datasets can be displayed side by side, for example, if you wanted your stores and those of your competitors shown on the same map.
Heat or choropleth mapping
Heat mapping presents complex data in a striking way that is immediately informative to the viewer. Many businesses use this form of mapping to plot key aspects of their business data such as:
- Plotting density of postcode point data such as customer or competitor locations
- Showing average values in an area for value data such as purchase levels
- Summarising demographic trends amongst an audience
- Demonstrating distance of an area from stores or reps
The output areas for your maps can be set by postcode, administrative geography (typically used by local government), or entirely bespoke areas defined by you, whilst colour coding can be a more traditional red, amber, green, or any colour scale to match your chosen theme or company brand.
Postcode territory mapping
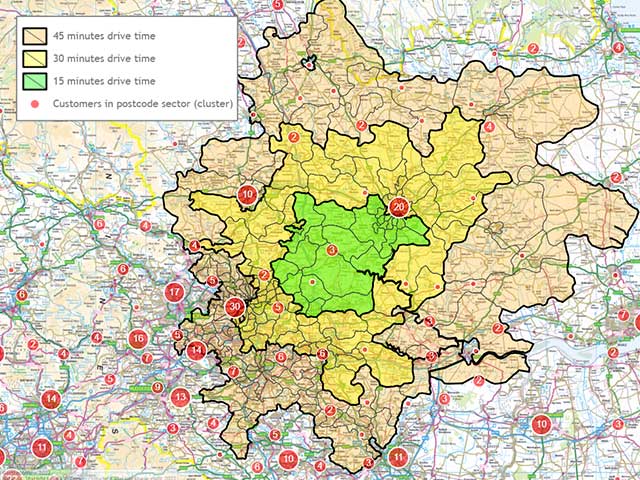
We create territories or catchments to guide sales or delivery networks based on:
- A list of existing postcode references
- Fixed distance radii from set starting points
- Actual on-road travel distances or times from a starting point
- Customer value or count within an area
- Density or number of households fitting certain demographic groupings
Catchments can be calculated to allow overlaps or draw definite borders between areas. Our tools will distribute areas based on a criteria you set.
Postcode sector or area mapping
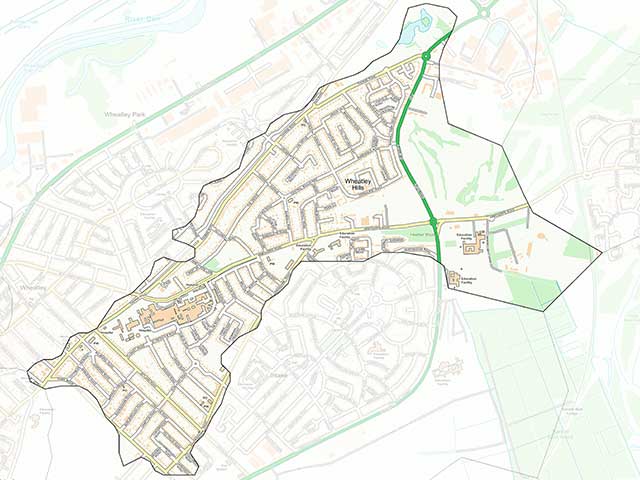
Sometimes it isn't what is in an area, but the area itself that needs mapping. If, for example, your community project is targeted within a particular postcode sector boundary, or your door-to-door team has fixed target areas, then being able to create maps showing only that area can be valuable. We can help you with extent mapping for:
- Postcode sectors or areas
- Administrative regions
- Demographic boundaries
These maps are provided digitally or as high-resolution printed maps.
How Beacon Dodsworth can help you with postcode mapping
We’ve been working with geographical data since 1994 and specialise in UK postcode geography mapping and data analysis.
Our mapping consultancy service provides a cost-effective way for any
organisation to have access to a GIS mapping expert with our entire range of mapping tools and geodata products at their fingertips.
Learn more about our consultancy services…
If you aren’t sure which solution is best for you, or if you’d like a demonstration of what we can do, please get in touch for an informal discussion.
How can we help you?
Whether you are looking for a simple customer map, or a complete location analysis, we have the tools and expertise to help.